


The Hevasure dashboard, a window into your data
The Hevasure Dashboard
The Hevasure dashboard is a window into your data. Accessible from laptops or mobile devices, it is fully interactive with easy navigation.
The home screen provides a simple, ‘easy-on-the-eye’, view of all the latest system parameters, colour-coded red, amber, or green depending on operating conditions and tolerances. Any parameter outside acceptable limits will be red and an email alarm will be raised.
Already a Hevasure customer?
Login to your dashboard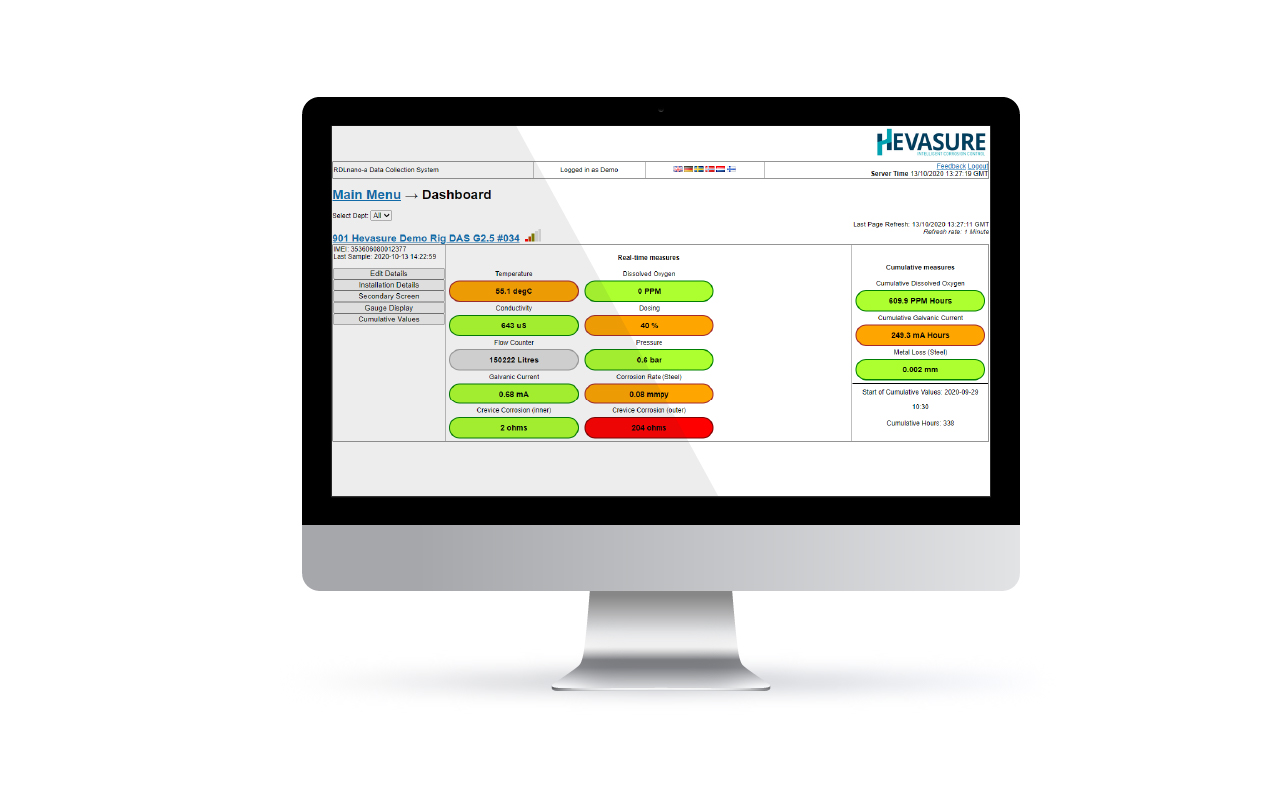
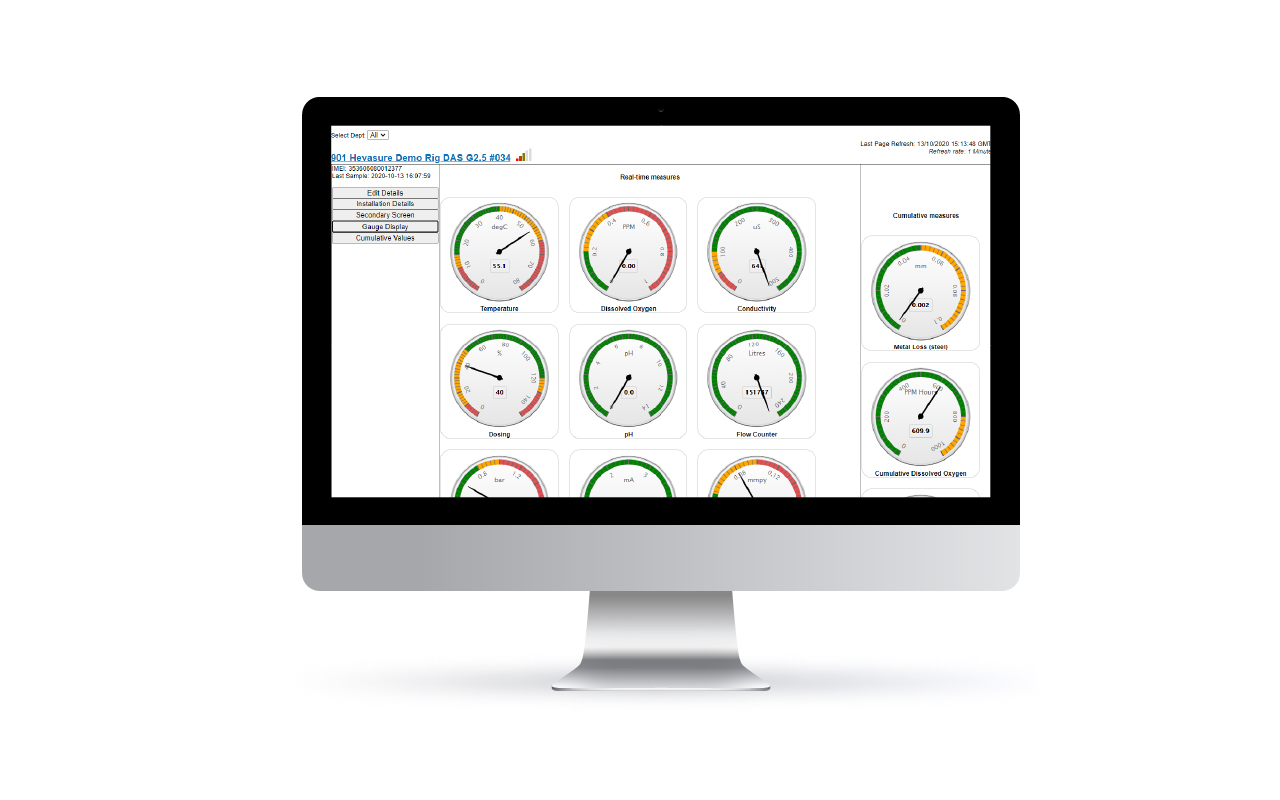
Alternative dial views are available showing how close the real-time value is to pre-set limits. Also available are dials showing cumulative values which provides a valued insight into the extent of any damage.
A graphical view of the data is only one click away…
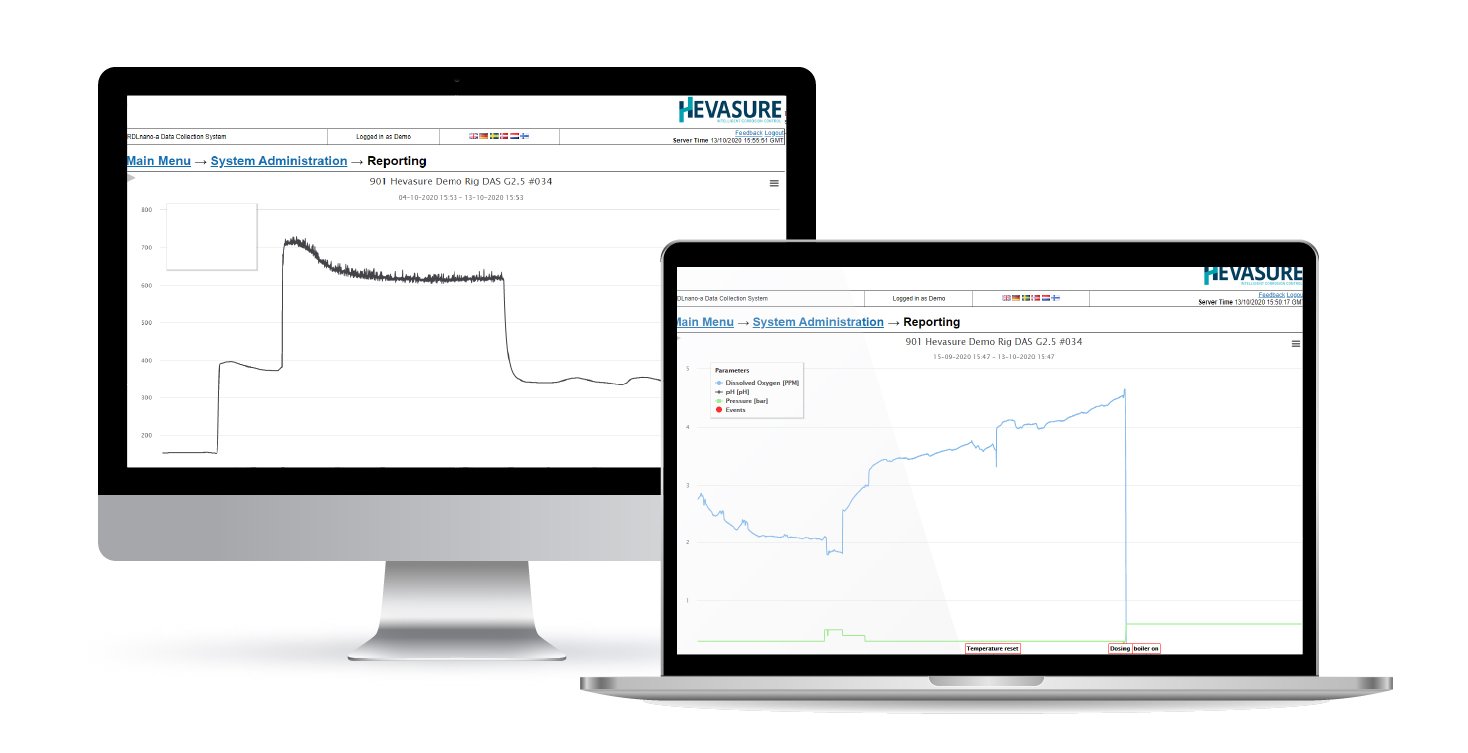
All events can be captured by setting flags on the charts, helping keep all data in one place.
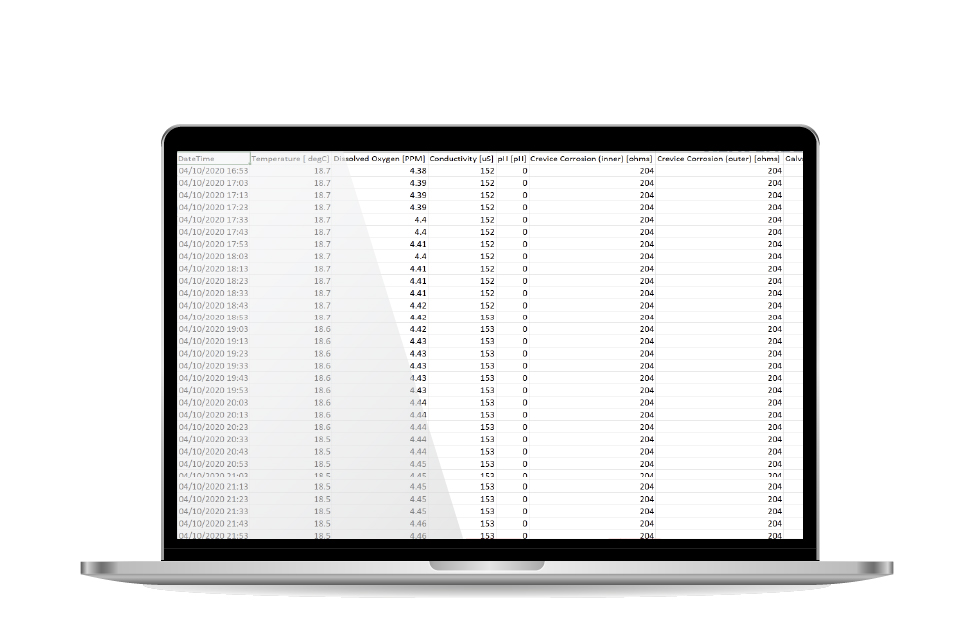
Finally, all data is available as a csv download with all measurements date & time stamped.
View the Hevasure dashboard demo
Go to the dashboard demo using the link below and login with:
Username: Demo, Password: Demo, Company ID: 58